How to Solve for the N+1 Query Problem: Investigating and Optimizing Over-Querying
Imagine you're running a popular e-commerce online bookstore that offers a vast collection of titles and authors to a growing user base. However, you've noticed a troubling trend over the past few months: the website is gradually slowing down, especially during peak hours when users browse various book categories. After an initial investigation, you find that the cause of the slowdown isn't an increase in user traffic or a lack of server resources. Instead, it's rooted in the very foundation of how your application interacts with your Postgres database.
The culprit? N+1 query problems. As more users navigate your site, more requests are made to the database to fetch information. Instead of being efficiently retrieved in grouped queries, each request individually pulls associated data like author details, reviews, and related books. What should have been a streamlined operation has turned into a burdensome load on your database, leading to longer load times and a compromised user experience.
This scenario is not unique to your online bookstore. Regardless of size or domain, many applications encounter similar performance bottlenecks due to N+1 queries. Understanding the nature of these queries, their impact on database performance, and how to optimize them is crucial for developers and database administrators. Here, we’re going into N+1 queries in a Postgres environment, providing insights and strategies to turn a potential database nightmare into a well-optimized, efficient system.
What Are N+1 Queries?
N+1 queries are a common performance bottleneck in databases. This issue occurs when an application performs an initial query to retrieve a set of records, followed by additional queries for each individual record. The name 'N+1' stems from making one (1) initial query and then N additional queries, resulting in N+1 total queries for N records.
Let’s say you have an application that displays user profiles and their respective posts. The application first executes a query to fetch all users. This is the "1" in N+1. The application performs another query for each user retrieved to fetch their posts. If there are ten users, this results in 10 additional queries (the "N" in N+1), totaling 11 queries. While this approach may seem straightforward, it's highly inefficient, especially as the number of users grows.
Let’s look at what this looks like. Assume you have two tables: users and posts. Each user has multiple posts. The posts table has a foreign key that references the users table. You want to display each user along with their posts.
- Users Table:
id(Primary Key)name
- Posts Table:
id(Primary Key)contentuser_id(Foreign Key to Users)
A naive N+1 query to get these posts might look like this:
-- Query 1: Fetch all users
SELECT id, name FROM users;

-- For each user obtained from the above query, execute the following query:
SELECT content FROM posts WHERE user_id = [user_id];
Here, Query 1 is the "1" query. Query 2 will be the “N” queries, where you iterate through the user_ids.
As a result, if there are 100 users, the total number of queries executed will be 101: 1 for fetching all users and 100 for fetching the posts for each user. This is a classic example of an N+1 query problem and can lead to performance issues, especially with a large number of users and posts.
N+1 Queries in ORMs
It’s common to find N+1 queries in frameworks using Object-Relational Mappings (ORMs). These are designed to convert models in an application into SQL statements to query data in relational databases. However, they often exacerbate the N+1 query issue due to their internal mechanisms.
Let’s use the Python web framework Django as our example. In Django, an N+1 query problem can quickly occur when you have related models and access related data without properly optimizing your queries. Let's consider a scenario where each User has a foreign key to a Profile model:
# models.py
from django.db import models

class Profile(models.Model):
    bio = models.TextField()
    # other fields like date_of_birth, location, etc.

class User(models.Model):
    name = models.CharField(max_length=100)
    profile = models.OneToOneField(Profile, on_delete=models.CASCADE)
    # other fields like email, etc.

# views.py
from django.shortcuts import render
from .models import User

def user_list(request):
    users = User.objects.all()
    user_profiles = []
    for user in users:
        profile = user.profile  # This creates the N+1 problem
        user_profiles.append((user, profile))

    context = {'user_profiles': user_profiles}
    return render(request, 'user_list.html', context)
Here, the User.objects.all() query retrieves all users. This is the "1" in N+1. Inside the loop, accessing each user's profile may result in a separate database query to fetch the corresponding Profile instance. This is the "N" part of N+1, where N is the number of users.
Because ORMs abstract away the underlying SQL queries, developers might not immediately realize that their code generates these inefficient N+1 queries.
The Impact of N+1 Queries on Performance
N+1 queries impact performance, especially in large-scale systems. These queries lead to inefficient data retrieval, increased load on the database, and, ultimately, a poor user experience. Understanding the consequences of N+1 queries is crucial for database optimization.
Increased Database Load
Each additional query in an N+1 problem adds to the load on the database. This is particularly problematic with large datasets. For instance, if an application retrieves 1000 users and makes a separate query for each user's posts, it results in 1001 queries hitting the database instead of potentially just one. This extra load can slow down the database response times, affecting all application users.
Imagine a web application displaying a list of users and their recent activities. Without optimization, fetching 1,000 users might result in 1,001 queries (one to fetch all users and 1,000 to fetch activities for each). This heavy load can lead to longer wait times for the data to load, affecting user experience.
A high volume of queries also consumes more CPU and memory resources on the database server. In our previous example, instead of a single, efficient query, the server must process 1,001 queries, consuming more resources. This impacts the query in question and affects the overall efficiency of the database server, hindering its ability to handle other requests.
Scaling Challenges
Applications with N+1 query problems often struggle to scale. As the data grows, so does the number of queries. In a social media app, for example, as more users join and create posts, the N+1 issue exacerbates, leading to an exponential increase in queries. This scaling challenge can cause significant performance degradation over time, requiring more hardware resources to maintain the same level of performance.
The total time complexity for the N+1 queries pattern is O(N). As the number of records (N) increases, the total number of queries increases linearly. This linear growth can lead to significant performance degradation, especially with large datasets. Each query incurs a certain amount of overhead due to network latency, query parsing, execution planning, and data retrieval. This overhead, multiplied by the number of queries, can substantially affect performance.
Poor User Experience
The cumulative effect of these performance issues can result in longer loading times for users, negatively impacting the user experience. In an e-commerce site, if product details are fetched with N+1 queries, each additional millisecond in load time can potentially lead to lost sales as customers grow impatient and leave the site.
Consider a real-time data dashboard that monitors and displays various metrics. If each metric's data is fetched using separate queries for each element, the dashboard will experience noticeable delays, failing to deliver the real-time experience expected by users.
Detecting and Investigating N+1 Queries
Sometimes, the simplest way to detect N+1 queries is through careful code review. Reviewers can look for loops or iterative processes that make database calls, particularly in the context of ORMs or when accessing related data.
But N+1 queries can often be subtle and not immediately evident, especially in complex applications. Here are some effective strategies and tools that can be employed to detect and investigate N+1 queries:
Query Logging
Enabling query logging in Postgres is one of the first steps in detecting N+1 query problems. Logging all executed queries allows you to analyze the logs for patterns that indicate N+1 issues.
-- Set the logging level to log all statements
ALTER DATABASE your_database_name SET log_statement = 'all';
After enabling logging, look for sequences of similar queries that differ only in a parameter, such as multiple queries fetching details for different user IDs.
2024-01-23 10:00:01 UTC LOG:  statement: SELECT * FROM users
2024-01-23 10:00:02 UTC LOG:  statement: SELECT * FROM posts WHERE user_id = 1
2024-01-23 10:00:02 UTC LOG:  statement: SELECT * FROM posts WHERE user_id = 2
2024-01-23 10:00:02 UTC LOG:  statement: SELECT * FROM posts WHERE user_id = 3
2024-01-23 10:00:02 UTC LOG:  statement: SELECT * FROM posts WHERE user_id = 4
2024-01-23 10:00:02 UTC LOG:  statement: SELECT * FROM posts WHERE user_id = 5
2024-01-23 10:00:03 UTC LOG:  statement: SELECT * FROM posts WHERE user_id = 6
2024-01-23 10:00:03 UTC LOG:  statement: SELECT * FROM posts WHERE user_id = 7
2024-01-23 10:00:03 UTC LOG:  statement: SELECT * FROM posts WHERE user_id = 8
2024-01-23 10:00:03 UTC LOG:  statement: SELECT * FROM posts WHERE user_id = 9
2024-01-23 10:00:03 UTC LOG:  statement: SELECT * FROM posts WHERE user_id = 10
...
This is a strong indicator of N+1 queries.
Performance Monitoring Tools
Tools like pgBadger, DataDog, or ScoutAPM offer detailed insights into database performance. They can help identify inefficient query patterns that may suggest N+1 issues.
With pgBadger, you can analyze your Postgres logs to get a report highlighting frequently executed queries. A high frequency of similar queries can be a sign of N+1 problems.
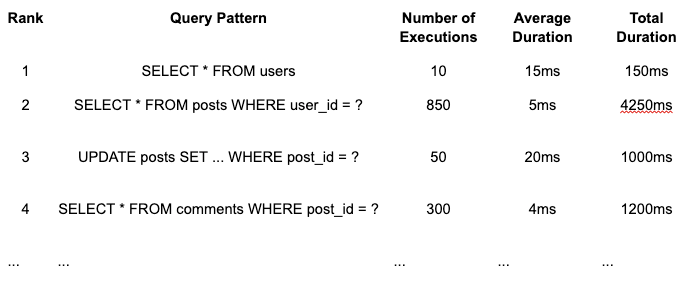
The SELECT * FROM posts WHERE user_id = ? query stands out due to its high frequency of execution (850 times). This pattern is indicative of an N+1 query problem. It suggests that for each user fetched by the SELECT * FROM users query (executed ten times), there are multiple subsequent queries to fetch posts. The average duration of each posts query is low (5ms), but the cumulative impact (total duration of 4250ms) is significant, pointing to a potential performance issue.
The disparity between the number of executions of the users query and the posts query is a classic sign of N+1 queries. From this, the recommendations might be to investigate the application code following the execution of SELECT * FROM users, especially the parts where posts for each user are accessed or displayed. Then, developers can optimize the query pattern to use JOIN operations or batch processing to reduce the total number of queries.
An application performance monitoring tool like DataDog or Scout APM will often automatically highlight inefficiencies in an application, such as N+1 queries.
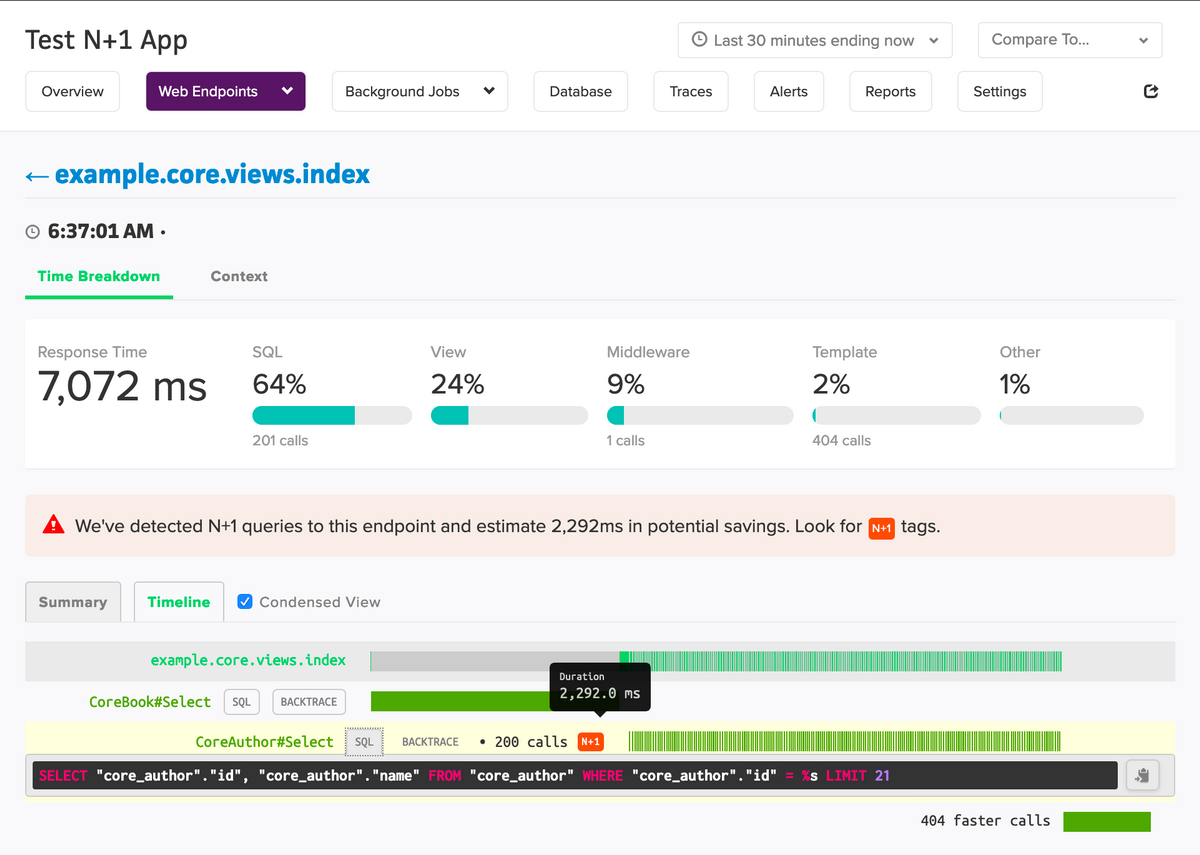
They can show the response times for these queries, the number of calls, and the query itself. This kind of report helps pinpoint where the application might be inefficiently using the database, guiding developers toward specific areas of the code that may need optimization to address the N+1 query problem.
Languages also have profiling tools built in, such as Python's cProfile. These can help detect N+1 queries by showing where your application spends most of its time.
import cProfile
cProfile.run('function_that_loads_data()')
This profiling can help identify functions that are making excessive database calls. A large amount of time spent in database-related functions could indicate N+1 queries.
Beyond language tools, most ORMs allow enabling SQL debug logging. This feature logs every SQL query the ORM executes, making spotting repetitive query patterns indicative of N+1 problems easier. Keeping with the Python theme, in Django, SQL debug logging can be activated by setting DEBUG = True in your settings.py, which causes all SQL queries to be printed to the console during development. You can also use Django's django.db.connection.queries for query insights.
EXPLAIN Command
The EXPLAIN command in Postgres is an invaluable tool for understanding how your queries are being executed. It can help you identify queries that do not efficiently use indexes or perform full table scans, which could be part of an N+1 problem.
EXPLAIN SELECT * FROM posts WHERE user_id = 1;The output provides insights into the query execution plan, which can help identify inefficiencies.
QUERY PLAN
-----------------------------------------------------------
 Seq Scan on posts  (cost=0.00..35.50 rows=1560 width=2048)
   Filter: (user_id = 1)
Here, EXPLAIN tells us we perform a “Seq Scan on posts.” This indicates that a sequential scan is being performed on the posts table. Sequential scans are generally less efficient than index scans, especially for larger tables, as they involve scanning each row.
The sequential scan (Seq Scan) on the posts table might not be a problem for a single query. However, suppose similar queries are being executed repeatedly for different user_id values (as in an N+1 scenario). In that case, it indicates that the database is performing numerous full table scans, which can be highly inefficient.
The absence of an index scan suggests that there might not be an index on the user_id column or the query planner did not find it efficient to use the index. For an N+1 query pattern, the repeated execution of such full table scans can significantly degrade performance.
Optimization and Query Design
Optimization and better query design are the only strategies to significantly reduce the impact of N+1 query problems in a Postgres environment. Doing so naturally leads to better application performance and scalability.
Eager loading
When using ORMs, the best solution (given you can’t optimize the query yourself) is eager loading. Eager loading involves modifying the query to fetch all related data in a single query instead of separate queries for each record. This can be achieved in ORMs with specific methods or query options (like .include in Rails or select_related in Django). These reduce the number of queries to the database, improving performance.
If we want to optimize our Django example above, this can be achieved through techniques like select_related or prefetch_related, designed to handle database queries more efficiently for related objects.
Assuming the User model has a ForeignKey to another model, let's say a Profile model, here's an optimized version of the Django code that avoids the N+1 query problem:
# models.py
from django.db import models

class Profile(models.Model):
    bio = models.TextField()
    # other fields

class User(models.Model):
    name = models.CharField(max_length=100)
    profile = models.OneToOneField(Profile, on_delete=models.CASCADE)
    # other fields

class Post(models.Model):
    user = models.ForeignKey(User, related_name='posts', on_delete=models.CASCADE)
    content = models.TextField()
    # other fields

# views.py
from django.shortcuts import render
from .models import User

def user_profiles(request):
    # Use 'select_related' to fetch the related Profile in the same query
    users = User.objects.select_related('profile').all()

    # 'prefetch_related' is used for reverse ForeignKey relationships
    # This fetches all related posts in a separate query, reducing the overall number of queries
    users = users.prefetch_related('posts')

    return render(request, 'user_profiles.html', {'users': users})
The select_related('profile') method is used with the User.objects.all() query. This fetches the associated Profile for each User in the same database query, thus avoiding separate queries for each user's profile.
The prefetch_related('posts') method handles the reverse ForeignKey relationship from User to Post. It performs a separate query to fetch all related posts and then efficiently pairs them with the corresponding users, which is more efficient than doing individual queries for each user's posts.
This approach significantly reduces the number of queries, particularly when you have a large number of users and posts, thus improving the performance of your Django application.
Caching
If you have particular queries you want to return fast, you can implement caching to reduce the need to query the database each time.
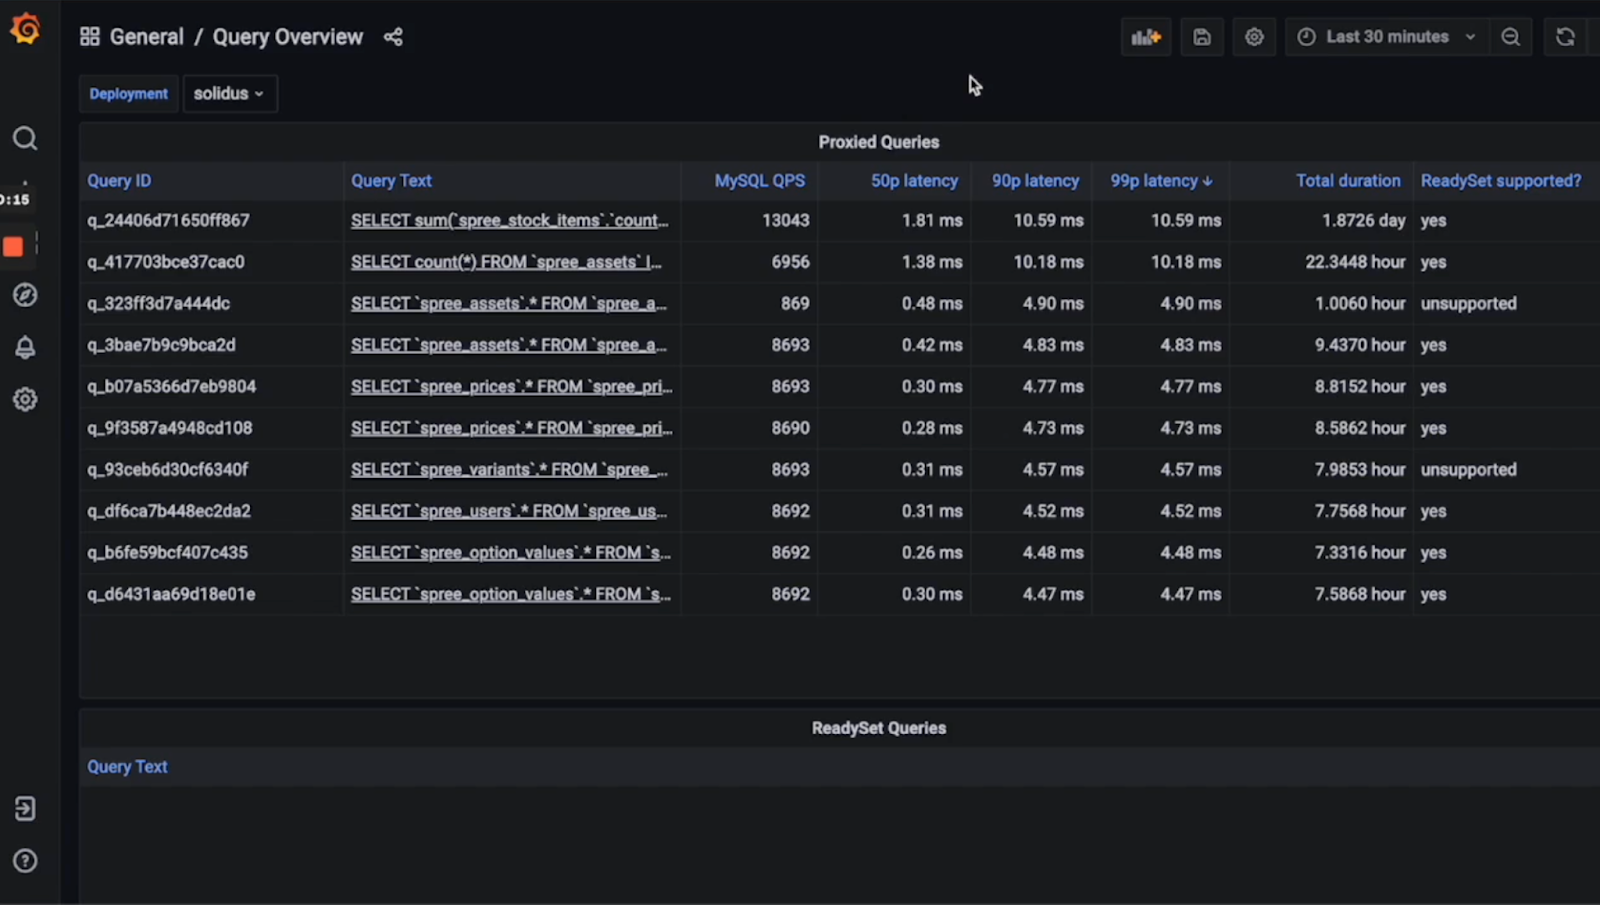
Readyset allows you to cache SQL queries without changes to your application code. The only change needed is to swap out your primary Postgres database connection string with a Readyset connection string. Readset will connect to your primary database and register with the replication stream. After snapshotting your database, every query will be proxied through Readyset. Along with your monitoring tools from above, you can then also use Readyset to understand your query performance:
When you have detected N+1 queries that can be cached (usually, ready-heavy queries are optimal candidates), you can start caching. In this case, we want to cache our posts queries. To do so, we just prepend CREATE CACHE FROM to our query:
CREATE CACHE FROM SELECT * FROM posts WHERE user_id = ?;The results from this query will now be served from Readyset with sub-millisecond latencies. Readyset monitors the replication stream from the primary database, looking for changes to the data, so the cache will be automatically updated whenever the underlying data is updated in the primary database.
Readyset also works with ORMs to help increase performance and optimize those queries under the hood.
Query design
Just as you can optimize your system around your queries, if you aren’t using an ORM, you can also optimize your queries for better performance. Here are a few options:
- Use Joins Appropriately: Utilize SQL joins to combine data from multiple tables in a single query. Understand the differences between
INNER JOIN,LEFT JOIN, etc., and choose the most appropriate use case to avoid unnecessary data retrieval. - Select Only Required Columns: Specify the columns you need in your
SELECTstatements rather than usingSELECT *. This reduces the amount of data transferred and processed, making the query more efficient. - Understand and Use Indices: Ensure your queries effectively leverage indices, especially for columns in
JOIN,WHERE, orORDER BYclauses. Regularly review and optimize indices based on query patterns and data changes. - Avoid Looping Queries: Identify scenarios where your code iteratively executes queries (like in a loop) and refactor them to use bulk data retrieval techniques. Replace multiple small queries with fewer, more comprehensive queries.
- Limit Data with Pagination: When dealing with large datasets, use pagination to limit the data retrieved and processed in a single query. This improves both database and application performance.
Thus, to optimize the basic queries from above, you could add a join into your query to fetch all the data at once:
SELECT u.id, u.name, p.content
FROM users u
LEFT JOIN posts p ON u.id = p.user_id
Solving the N+1 Puzzle
N+1 queries can destroy your application’s performance as you scale. What’s worse is that this issue can be abstracted from you by ORMs and other high-level frameworks, making them harder to detect and resolve. But with monitoring tools and a better understanding of the problem, you can detect these troublesome queries and work to improve your query design and optimize your performance.
At Readyset, we are building ways to help developers and platform engineers do just that. By caching queries, you can significantly improve your response latencies while still serving your users' fresh data. If this sounds like something that will help you, sign up for Readyset Cloud or reach out to us if you have any questions.